Code for San Francisco: A Civic Hacking Project
Code for San Francisco is a Code for America Brigade, a non-profit volunteer group of developers, designers, data scientists, and citizen activists who use creative technology to solve civic and social problems.
I joined the local chapter in July, inspired by a Code for America presentation at SF Design Week that reminded me the importance of human-centered service design in government. As the BLM movement galvanized America just weeks prior, I was fired up and ready to do my part in support of this human rights movement. I met like-minded people on my first virtual working session, and quickly joined a new project: the tracking city budgets project.
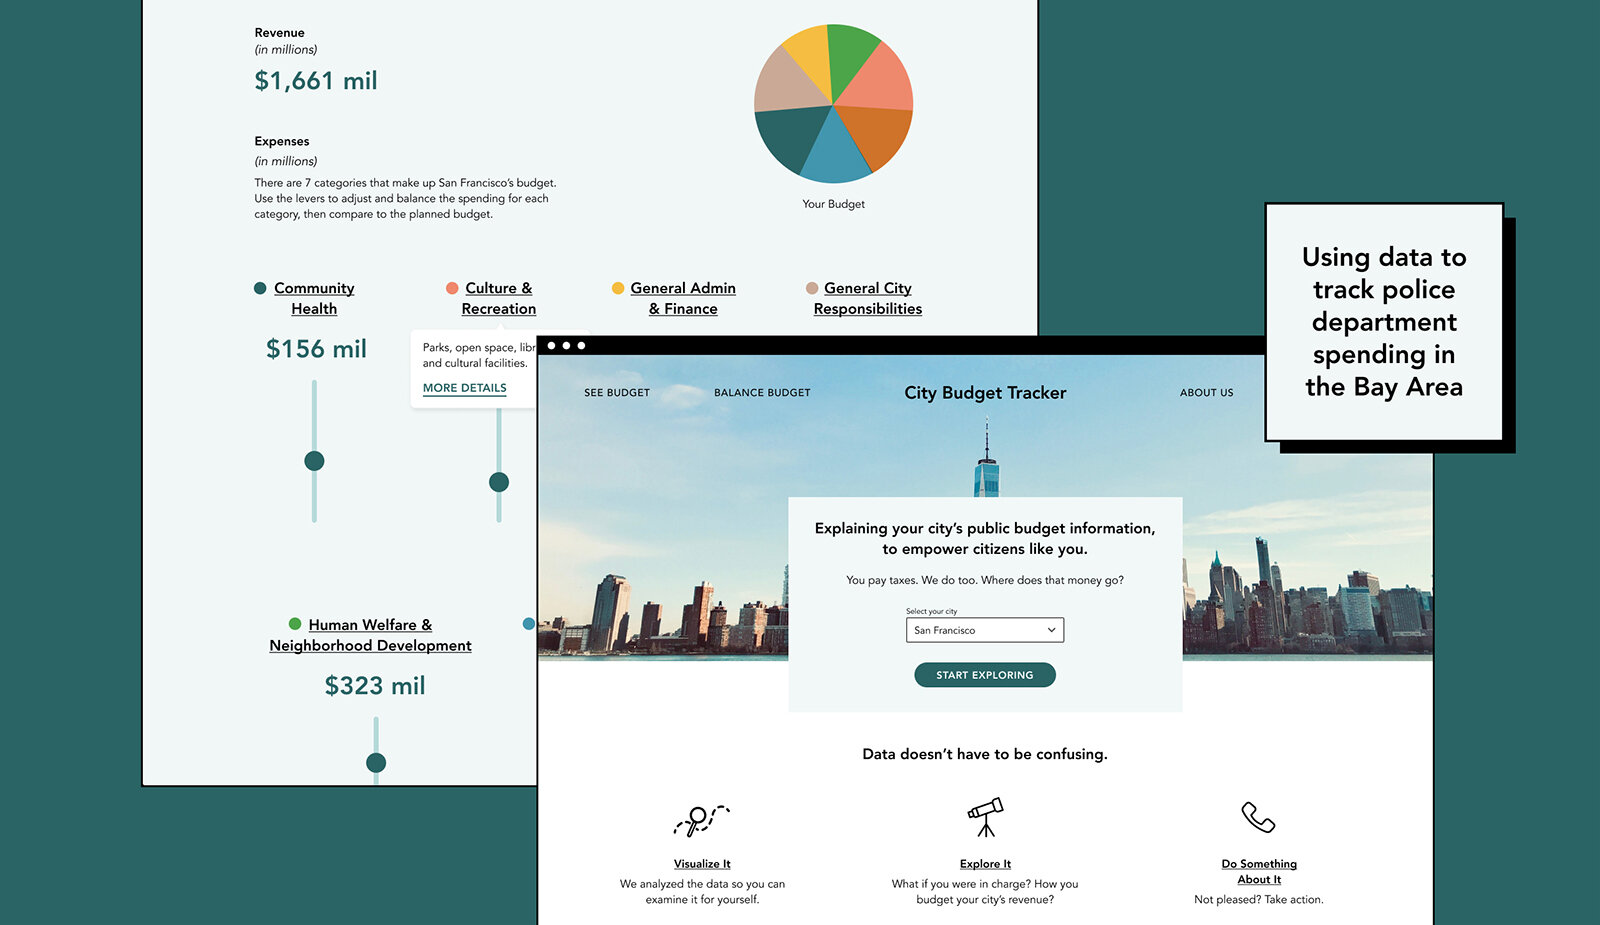
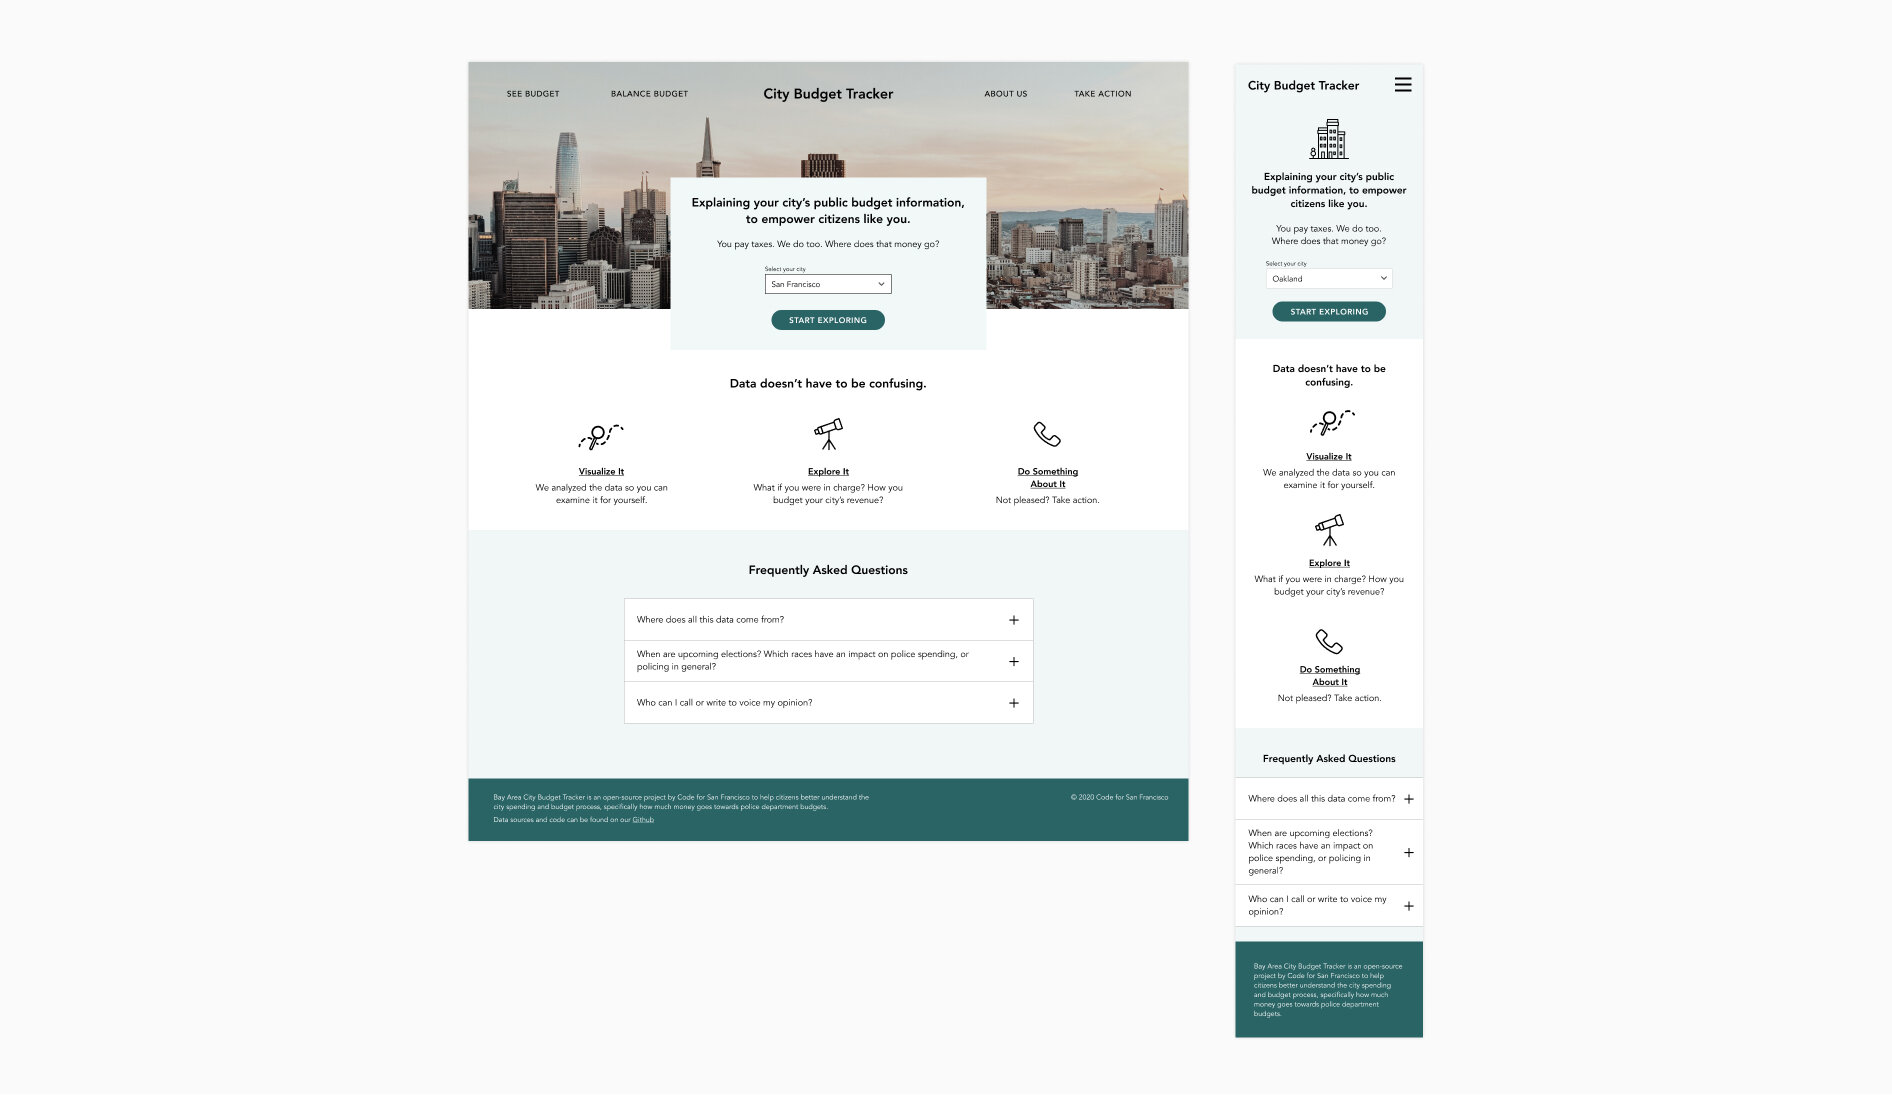
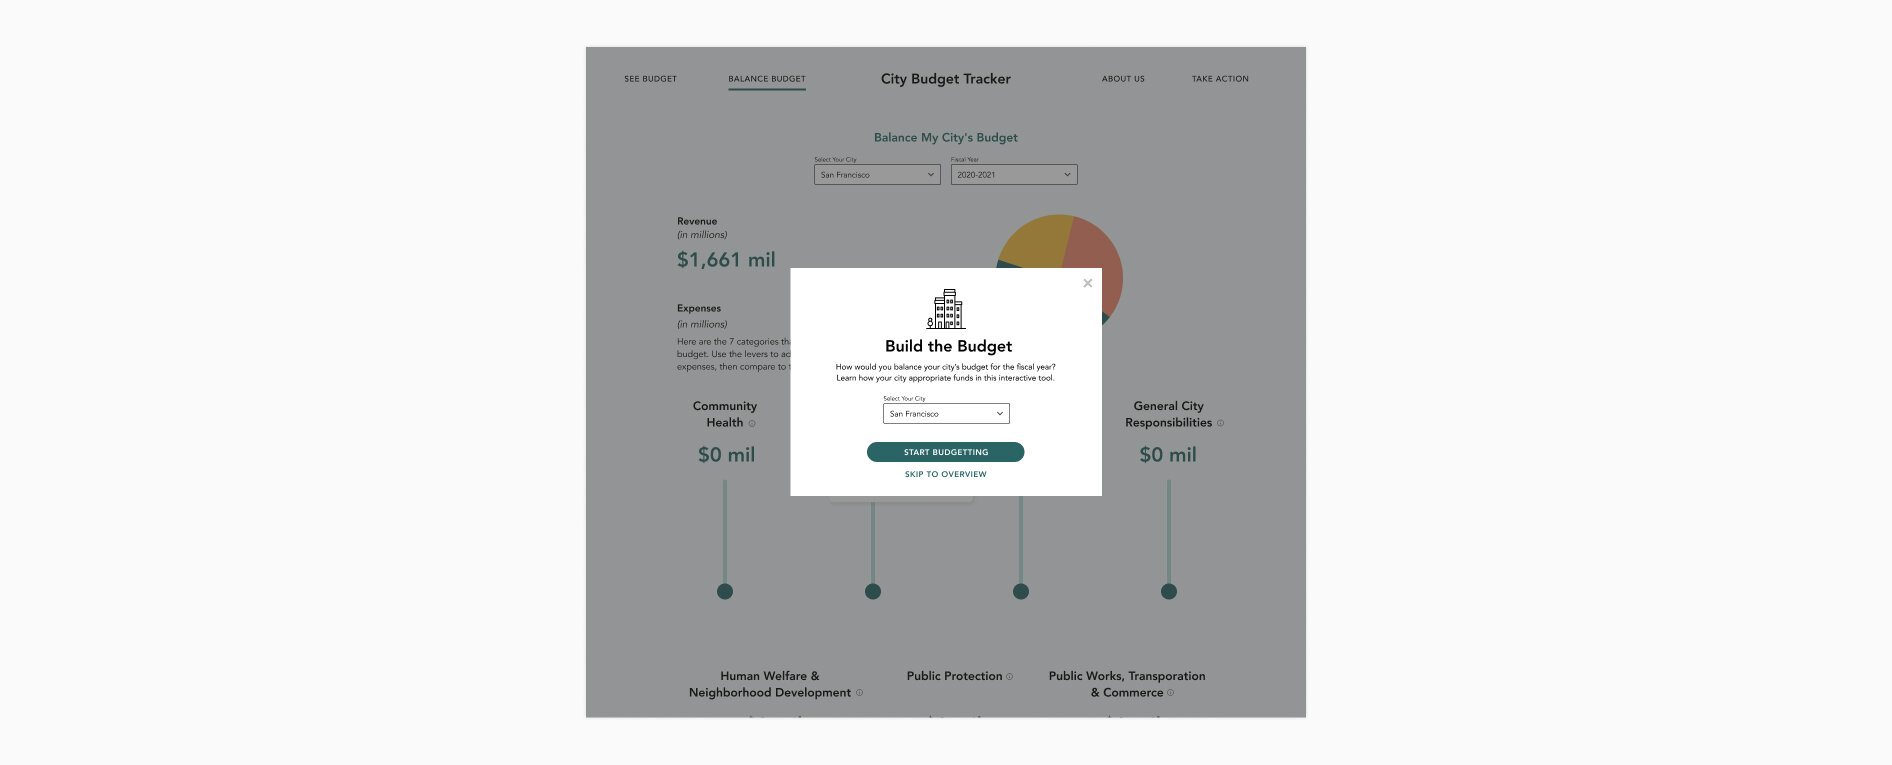
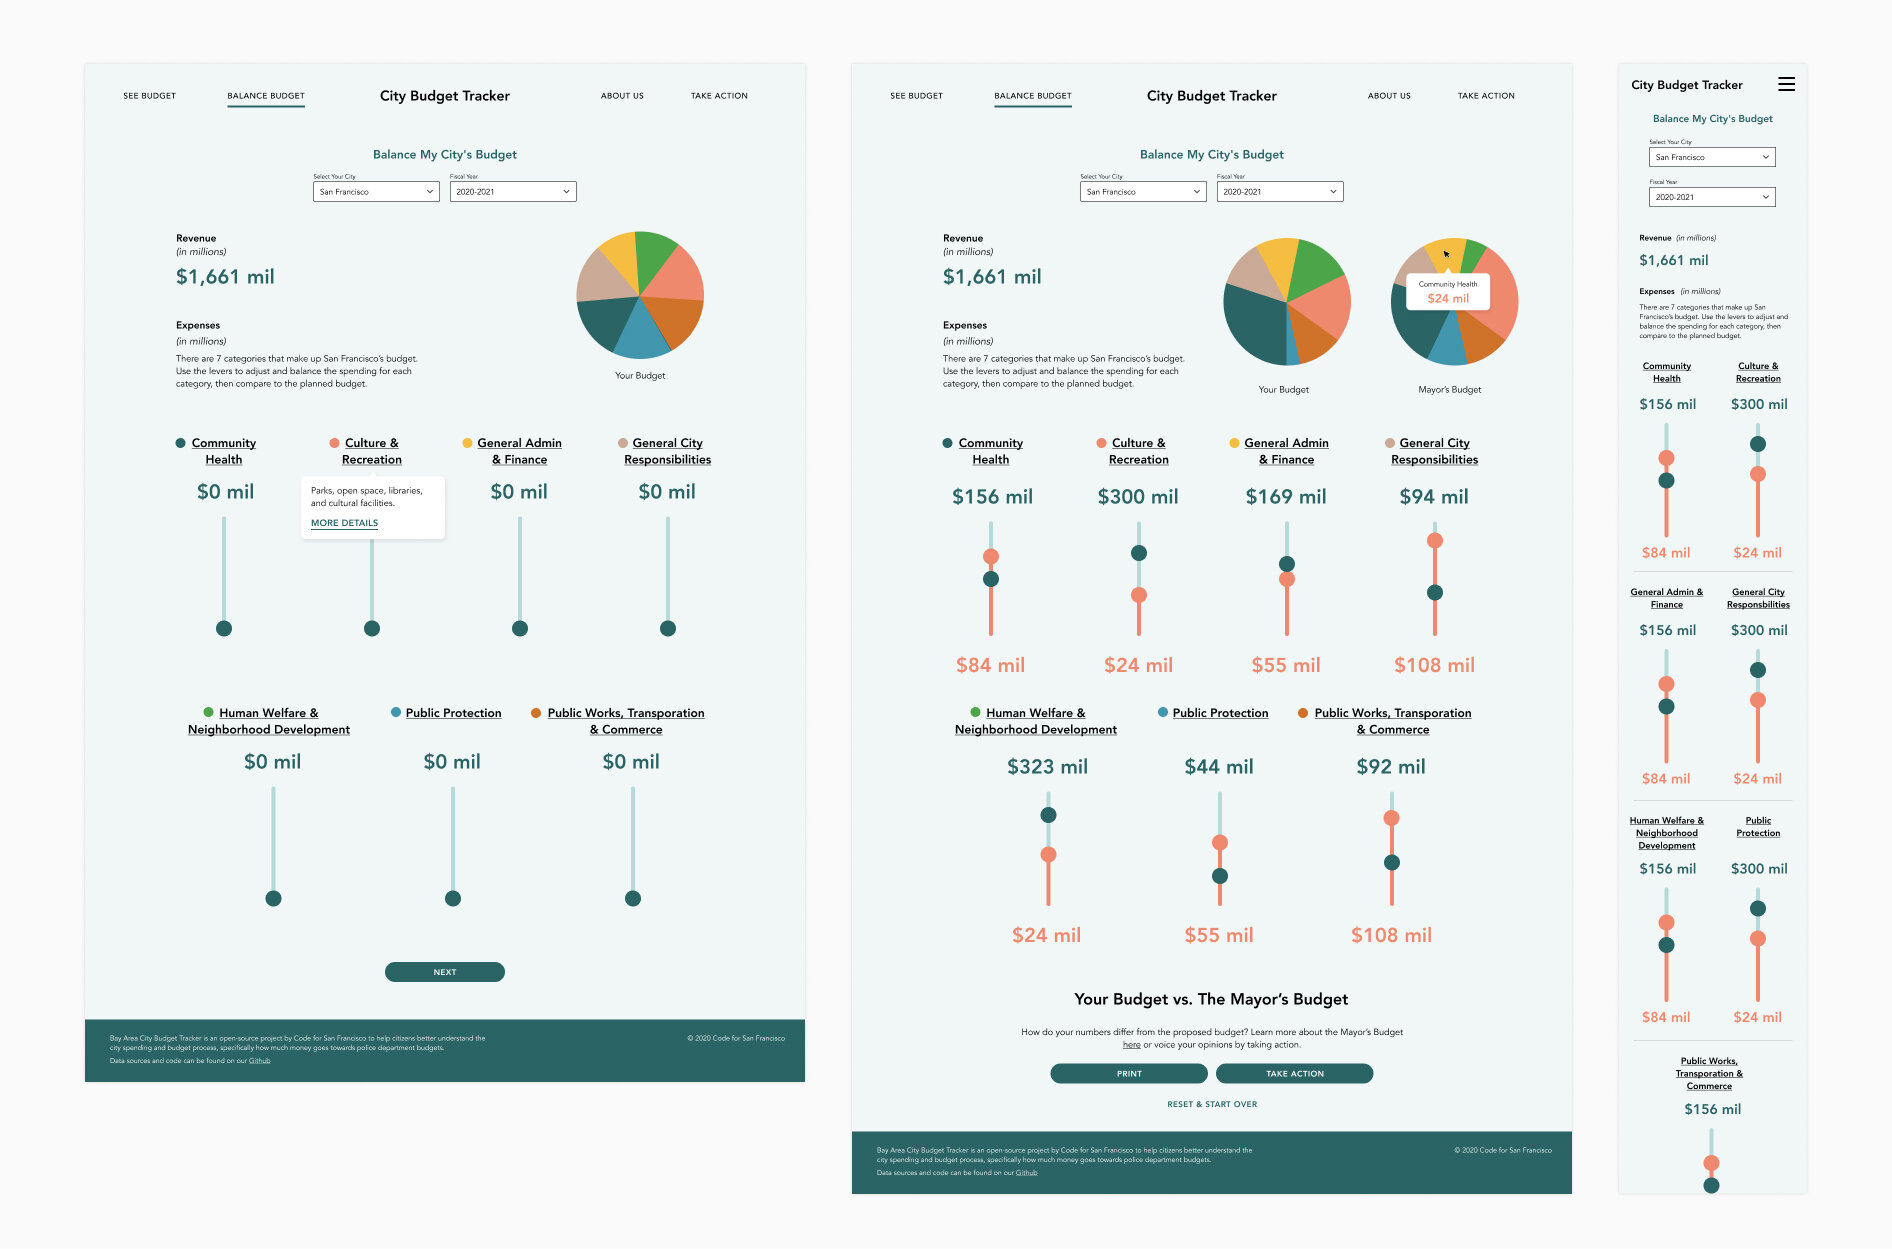
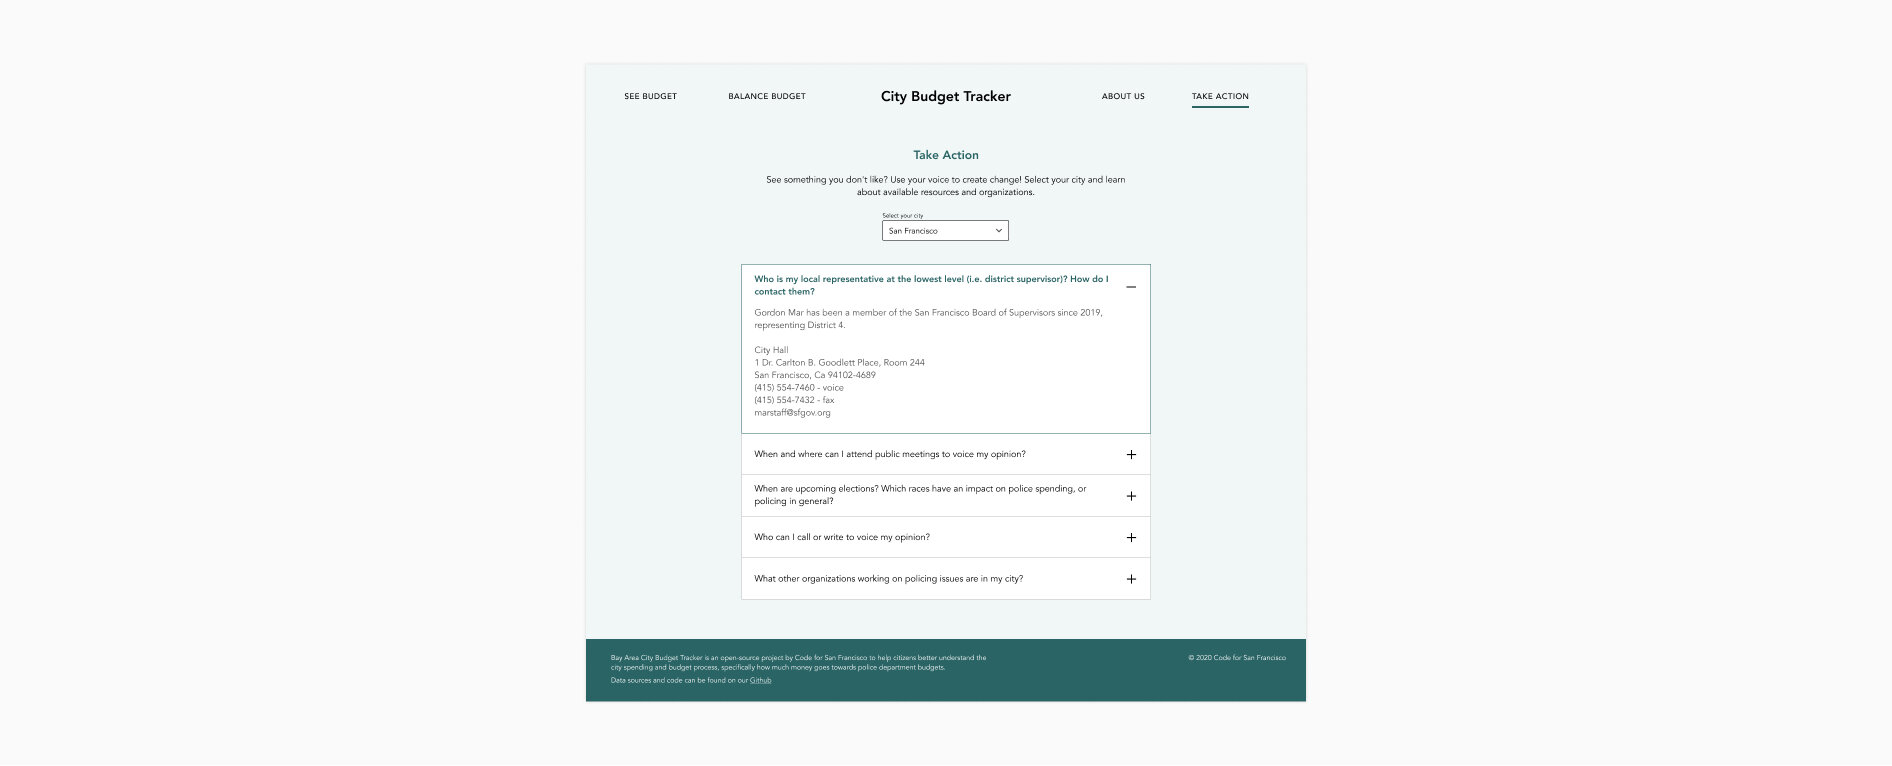
The City Budget Tracker is a website that uses analytics and data visualization to understand Bay Area budgets and spending on police departments. Using a data narrative and an interactive budget builder tool, it educates the citizens about the city budget and tradeoffs, and empowers them to take action. As the sole designer, my role was to translate these ideas into an interactive site that presented the information in an engaging and elegant way, along the way defining scope and supporting development. I also took on additional responsibility of writing copy for the budget builder tool, summarizing San Francisco’s proposed budget into concise colloquial descriptions that help people easily understand how funds are used within each city department.
Our goal was to tell the story of police spending, using data to highlight the glaring disparity between crime rates and the presence of police forces patrolling the streets. We aimed to highlight the most astonishing and impactful facts we’ve observed from digging into historical data, and objectively convey it in a digestible way.
This project is still in the works (the data narrative page is our next focus) but I wanted to share and reflect on the work I’ve done so far.
For one, data storytelling is hard. I truly admire sites like New York Times that so successfully tell impactful multimedia stories using data visualization. As a designer whose everyday job is to create visuals, all of this was extremely new to me but I was excited to learn and experiment. (Would love any resources people can recommend!)
Another huge challenge was our lack of domain knowledge. Our team was made up of data scientists and developers, none of who are familiar with the city’s departmental makeup. We spend a majority of time doing research, which meant I spent a lot of time poring over the 300-page mayor’s budget, but ended up learning a ton. Never one to get too involved in politics, I felt like I was doing my duty as a citizen to inform myself of the things my city does for its citizens. Where is our taxpayer money actually going? Although not perfect, the city does have systems in place that benefit our well-being through services, programs, aid, and so much more. Serving the public is a hard task, but it definitely works out better when the public is informed and getting involved in this democracy.
Shoutout to the data team for doing the work and digging into all this data. It feels good to work with brilliant passionate people every week. Excited to continue the project!
—
Team: Dan Carmody, Chamoun Saoma, Craig Mariani, Ifedayo Famojuro, James Baskerville, Kimberly Bourque, Kristin Li, Robby Taine, Justine Schott, Sophia Liu, and many more!